|
|
Machine Learning 2011. 5. 14. 18:20
서명 / 저자 The Bayesian choice : from decision-theoretic foundations to computational implementation / Christian P. Robert. 저자명 Robert, Christian P., 1961- 판사항 2nd ed. 발행사항 New York : Springer, c2001. 총서명 Springer texts in statistics

|
| 등록번호 |
소장위치 / 청구기호 |
도서상태 |
반납예정일 |
|
| 6009339 |
대전 중앙관4층 일반도서실 / QA279.5 .R6313 2001 |
서명 / 저자 Bayesian data analysis / Andrew Gelman ... [et al.]. 저자명 Gelman, Andrew. 발행사항 London ; New York : Chapman & Hall,1995. 총서명 Chapman & Hall texts in statistical science series
Texts in statistical science.
|
| 등록번호 |
소장위치 / 청구기호 |
도서상태 |
반납예정일 |
|
| 5033709 |
대전 중앙관4층 일반도서실 / QA279.5 .B39 1995 |
서명 / 저자 빵가게 재습격 : 무라카미 하루키 소설 / 무라카미 하루키 지음 ; 권남희 옮김. 저자명 무라카미 하루키, 1949- ; 권남희 발행사항 파주 : 문학동네, 2010. 총서명 문학동네 세계문학
|
| 등록번호 |
소장위치 / 청구기호 |
도서상태 |
반납예정일 |
|
| 5078504 |
대전 중앙관2층 일반도서실 / PL856.U745 빵7422 |
Machine Learning 2010. 1. 9. 14:59
컴파일 성공 with xcode
katty2.1.zip
Machine Learning 2010. 1. 7. 14:24
0. Compile ode.11.1 according to the instruction in the 'readme' file
- If it doesn't copy libs and headers in /usr/local/** then;
-- copy libdrawstuff.a, libdrawstuff.la, libode.a, libode.la into /usr/local/lib
-- copy ode/*.h into /usr/local/include/ode
-- copy drawstuff/*.h into /usr/local/include/drawstuff
1. File->New Project->Command LIne Utility/C++ Tool

2. Select folder and Name the project as you want
3. Create Group names "Frameworks" and add 3 Frameworks (AGL.Framework, Carbon.Framework and OpenGL.Framework)

4. Drag 3 frameworks and drop them into Target->[yourProjectName]->Copy Files

5. Copy contents of "demo_friction.cpp" (for example) and past it on the main.cpp file.

6. Goto "project [yourProjectName] Info" -> "Build" Tap -> "Search Paths" section;
- add "/usr/local/include" on "Header Search Paths"
- add "/usr/local/lib" on "Library Search Paths"
7. Goto "project [yourProjectName] Info" -> "Build" Tap -> "Linking" section;
- add "-ldrawstuff -lode" on "Other Linker Flags"

8. Copy "texturepath.h" and "textures" folder into your project directory
9. Compile and Run~!
katty2.0.zip
Machine Learning 2010. 1. 5. 16:49
Matt's Matlab Tutorial Source Code Page
This document contains a tutorial on Matlab with a principal components analysis for a set of face images as the theme.
I wrote this tutorial while a graduate student in the Artificial Intelligence Laboratory of the Computer Science and Engineering Department at the University of California, San Diego. Now it's here at CSIM-AIT. You might still be able to find the original here.
 This work is licensed under a Creative Commons Attribution 3.0 License. You are free to use the code here for any purpose you like, but please acknowledge its source if you do. It's not required, but if you make improvements I'd appreciate it if you sent me your updates. This work is licensed under a Creative Commons Attribution 3.0 License. You are free to use the code here for any purpose you like, but please acknowledge its source if you do. It's not required, but if you make improvements I'd appreciate it if you sent me your updates.
Here's an index to this tutorial:
I used the Ekman and Friesen Pictures of Facial Affect (POFA) for this tutorial. Unfortunately, the faces are copyrighted so if you want them you'll have to pay Paul Ekman some cash to get our online version of the database. Contact Gary Cottrell for details about our versions, or see http://www.paulekman.com/researchproducts.html on getting a CD directly from Ekman.
Don't despair, however. There are a bunch of nice face databases that are free. Check the Face Recognition Home Page for a list of what's available.
I won't go into it in detail here, but the idea is that face images can be economically represented by their projection onto a small number of basis images that are derived by finding the most significant eigenvectors of the pixelwise covariance matrix for a set of training images. A quick Google Search shows that a lot of people like to play with this technique. In my tutorial I simply show how to get some eigenfaces and play with them in Matlab.
If you don't use emacs, the Matlab emacs mode may be one reason to use it. To get Matlab mode working in emacs, put matlab.el somewhere emacs can find it and add something like the following to your .emacs file:
(autoload 'matlab-mode "matlab" "Enter Matlab mode." t)
(setq auto-mode-alist (cons '("\\.m$" . matlab-mode) auto-mode-alist))
(defun my-matlab-mode-hook ()
  (setq matlab-indent-function t)       ; if you want function bodies indented
  (setq fill-column 76)         ; where auto-fill should wrap
  (matlab-mode-hilit)
  (turn-on-auto-fill))
(setq matlab-mode-hook 'my-matlab-mode-hook)
(autoload 'matlab-shell "matlab" "Interactive Matlab mode." t)
(defun my-matlab-shell-mode-hook ()
  '())
(setq matlab-mode-hook 'my-matlab-mode-hook)
I don't pretend to understand any of this emacs stuff. For more information, you might try the Mathworks Matlab Central Contrib site.
Matlab can read PNG files and other formats without help. Here is how to read a PNG image into memory and look at the pixel values in its upper left corner. The ">>" is the Matlab prompt. Comments begin with a % sign.
>> help imread                    % Online help is useful...

 IMREAD Read image from graphics file.
    A = IMREAD(FILENAME,FMT) reads the image in FILENAME into
    A. If the file contains a grayscale intensity image, A is
    a two-dimensional array.  If the file contains a truecolor

    etc...

>> I = imread('test.png');        % Read image test.png into variable I
>> size(I)                        % Get the number of rows and columns of I

ans =

   320   240

>> I(1:10,1:10)                   % Display row 1-10 and col 1-10 of I

ans =

    26    20    20    22    22    20    19    20    22    22
    26    24    19    22    22    19    21    24    24    22
    25    24    22    24    21    19    20    22    24    22
    25    21    21    24    22    20    21    22    24    20
    24    20    22    25    22    19    20    21    25    24
    20    19    22    22    24    21    21    24    22    24
    20    20    21    25    25    24    24    25    20    20
    20    20    21    24    26    25    25    25    20    20
    20    19    22    24    24    25    24    24    22    21
    21    17    21    25    21    22    24    25    22    21

>> colormap(gray(256));          % Use a 256-value grayscale color map
>> image(I);                     % Display I as an image
>> daspect([1 1 1]);             % Set x:y aspect ratio to be 1:1
If you like the PGM format like I do, here are matlab functions for reading and writing them:
Matlab is really nice for linear algebra stuff and visualization, but sorta sucks when it comes to file I/O. Or rather, it's not much easier than C, although there are functions for reading and writing entire arrays to and from files. The following function, defined in load_images.m, is an example of how to read a bunch of images, make column vectors out of each of them, and return the result.
function [Images,w,h] = load_images(filelist,downscale_f)
%LOAD_IMAGES Load a set of images listed in a file.
%
%            [IMGS,W,H] = LOAD_IMAGES(FILELIST) Treat each line of
%            the file named FILELIST as the filename of a PGM image,
%            and load each image as one column of the return array
%            IMGS.
%
%            LOAD_IMAGES(FILELIST,DOWNSCALE_F) Do the same thing,
%            but downscale each image's width and height by a factor
%            of DOWNSCALE_F.  Useful if the images are too big to be
%            loaded into memory all at once.

% Matthew Dailey 2000

  % Check argument consistency

  if nargin < 1 | nargin > 2
    error('usage: load_images(filelist[,downscale_f]');
  end;
  if nargin == 1
    downscale_f = 1.0;
  end;
  Images = []; old_w = 0; old_h = 0; w=0; h=0;

  % Open input file

  numimgs = linecount(filelist);
  fid = fopen(filelist,'r');
  if fid < 0 | numimgs < 1
    error(['Cannot get list of images from file "' filelist, '"']);
  end;

  % Get the images

  for i = 1:numimgs
    imgname = fgetl(fid);
    if ~isstr(imgname)            % EOF is not a string
      break;                      % Exit from loop on EOF
    end;
    fprintf(1,'loading PGM file %s\n',imgname);
    Img = readpgm(imgname);       % Read this image as a 2D array
    if i==1                       % If this is first image, figure things out
      old_w = size(Img,2);        %   - like sizes of the downscaled images
      old_h = size(Img,1);
      if downscale_f <= 1.0
        w = old_w; h = old_h;
      else
        w = round(old_w/downscale_f); h = round(old_h/downscale_f);
      end;
      Images = zeros(w*h,numimgs);   % - preallocate size of the return matrix
    end;
    if downscale_f > 1.0
      Img = im_resize(Img,w,h);      % downscale using bicubic spline interp
    end;
    Images(1:w*h,i) = reshape(Img',w*h,1);   % Make a column vector
  end;
  fclose(fid);                    % Close the filelist when done

  fprintf(1,'Read %d images.\n',numimgs);

  % The function returns the output arguments Images, w, and h here.
The function has a downscaling factor that lets you save memory. To use the function, just create a file listing your images then run:
>> [Imgs,w,h] = load_images('facelist',4);
The im_resize function uses Matlab's built in 2-D function interpolation (using bicubic splines) to resize the image by the desired downscaling factor. If you want to run load_images, you also need the trivial little function linecount.
Here is how you would convert a column of Imgs back into an image and display it:
>> L = Imgs(:,10);
>> L = reshape(L,w,h)';         % Reshapes column vector into a 2D array
>> image(L);
>> colormap(gray(256));
>> daspect([1 1 1]);
The function pc_evectors uses Turk and Pentland's trick to get the eigenvectors of A*A' from the eigenvectors of A'*A. It uses the function sortem to sort the eigenvectors and eigenvalues by eigenvalue. [Here is a faster version, sortem2, by James Javurek-Humig, which is considerably faster, if you have matlab version 7 or better.] To use pc_evectors, just do:
>> [Vecs,Vals,Psi] = pc_evectors(Imgs,30); % Get top 30 PC evectors of Imgs
And to explore the eigenvalue spectrum and how much variance the first n vectors account for, try the following:
>> plot(Vals);                       % To plot the eigenvalues
>> CVals = zeros(1,length(Vals));    % Allocate a vector same length as Vals
>> CVals(1) = Vals(1);
>> for i = 2:length(Vals)            % Accumulate the eigenvalue sum
     CVals(i) = CVals(i-1) + Vals(i);
   end;
>> CVals = CVals / sum(Vals);        % Normalize total sum to 1.0
>> plot(CVals);                      % Plot the cumulative sum
>> ylim([0 1]);                      % Set Y-axis limits to be 0-1
This gives you something like the following:
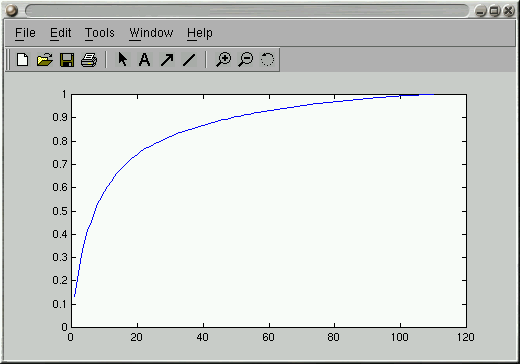
It depends on the application, but most folks seem to use a number of eigenvectors that account for variance somewhere in the 65%-90% range.
One thing that can be fun is to try to figure out what the top few eigenvectors encode. You can make a scatter plot of one component against another as follows:
>> Proj = Vecs(:,1:2)' * Imgs;       % Project each image onto first 2 evectors
>> size(Proj)

ans =

     2   110

>> plot(Proj(1,:),Proj(2,:),'r.')    % To get scatterplot of PC 1 vs PC 2
And if you wanted to add text labels to each of the points in the plot, you could do the following. First create a file containing the labels you want, in the correct order. Then read it into a Matlab string array:
>> Labels = textread('labels','%s');    % Read labels from file 'labels'
>> text(Proj(1,:),Proj(2,:),Labels);    % Add text labels at each plotted point
It is simple to display an eigenface as an image, using the built in imagesc function, which first scales the values in an array to the 0-255 range.
>> pc_ev_1 = Vecs(:,1);                 % Get PC eigenvector 1
>> pc_ev_1 = reshape(pc_ev_1,w,h)';     % Reshape into 2D array
>> imagesc(pc_ev_1);                    % Display as image scaled 0-255
Finally, you might be interested in determining the reconstruction error involved in representing an image by its projection onto a few eigenvectors. Here is how you would project onto and reconstruct from eigenvectors 1-10.
>> OrigImg = Imgs(:,20);                     % Grab image 20
>> Projection = Vecs(:,1:10)'*(OrigImg - Psi);    % Project onto ev's 1-10
>> Reconstruction = Vecs(:,1:10)*Projection+Psi;  % Reconstruct from projection
>> Reconstruction = reshape(Reconstruction,w,h)';
>> image(Reconstruction);
>> colormap(gray(256));
>> daspect([1 1 1]);
mdailey@ait.ac.th
http://www.cs.ait.ac.th/~mdailey
Last Updated: 01/05/2010 10:46:39
Machine Learning 2009. 12. 31. 19:50
* Wifi configuration
- Turn on the robot with network cable connected.
-- the network cable should be connected with a router which the user computer connects to.
- Get IP by pushing the Nao's chest button
- http://robotip
- config wifi with WPA encryption
* How to register user programmed modules
- consol (1)
-- ./mymodulename -pip robotIP
-- (example) - ./getandset -pip 192.168.0.16
- consol (2)
-- python modulerunner.py
--- modify IP address (If robotIP is 192.168.0.16)
----broker = ALBroker("pythonBroker","192.168.0.16",9559,"192.168.0.16",9559)
-- (example) python run.py
Machine Learning 2009. 12. 13. 22:25
* Install "Eclipse Classic" (cuz we require 'Ant' to use existing makefiles)
* Install CDT via Software update by adding the following site
http://download.eclipse.org/tools/cdt/releases/ganymede
* How to create a (existing makefile)project in Eclipse
* How to use 'Ant'
http://www.ibm.com/developerworks/aix/library/au-unix-eclipse/index.html
Ex)
Listing 1. Ant build file for working with unzip
<?xml version="1.0"?>
<project name="unzip" default="make">
<description>
Ant adaptor for the unzip Makefile.
</description>
<target name="make" description="build unzip">
<exec executable="make">
<arg value="-f"/>
<arg value="unix/Makefile"/>
<arg value="generic"/>
</exec>
</target>
<target name="test" description="test unzip"
depends="make">
<exec executable="make">
<arg value="-f"/>
<arg value="unix/Makefile"/>
<arg value="test"/>
</exec>
</target>
<target name="install" description="install unzip"
depends="make">
<exec executable="make">
<arg value="-f"/>
<arg value="unix/Makefile"/>
<arg value="install"/>
</exec>
</target>
<target name="clean" description="clean unzip">
<exec executable="make">
<arg value="-f</arg>
<arg value="unix/Makefile</arg>
<arg value="clean"/>
</exec></target>
</project>
|
Now you can right-click the build.xml file and run it as an Ant build (Run As > Ant Build). The launch dialog (see Figure 15) lets you choose which build target to run.
Figure 15. The build targets for our unzip project

You can see your build progress in the Console view, which will fill up with the output of your make command. As you can see from Figure 16, you've done it!
Machine Learning 2009. 12. 9. 19:41
A simple explanation of the Lasso and Least Angle Regression
Give a set of input measurements x1, x2 ...xp and an outcome measurement y, the lasso fits a linear model
yhat=b0 + b1*x1+ b2*x2 + ... bp*xp
The criterion it uses is:
Minimize sum( (y-yhat)^2 ) subject to sum[absolute value(bj)] <= s
The first sum is taken over observations (cases) in the dataset. The bound "s" is a tuning parameter. When "s" is large enough, the constraint has no effect and the solution is just the usual multiple linear least squares regression of y on x1, x2, ...xp.
However when for smaller values of s (s>=0) the solutions are shrunken versions of the least squares estimates. Often, some of the coefficients bj are zero. Choosing "s" is like choosing the number of predictors to use in a regression model, and cross-validation is a good tool for estimating the best value for "s".
Computation of the Lasso solutions
The computation of the lasso solutions is a quadratic programming problem, and can be tackled by standard numerical analysis algorithms. But the least angle regression procedure is a better approach. This algorithm exploits the special structure of the lasso problem, and provides an efficient way to compute the solutions simulataneously for all values of "s".
Least angle regression is like a more "democratic" version of forward stepwise regression. Recall how forward stepwise regression works:
Forward stepwise regression algorithm:
- Start with all coefficients bj equal to zero.
- Find the predictor xj most correlated with y, and add it into the model. Take residuals r= y-yhat.
- Continue, at each stage adding to the model the predictor most correlated with r.
- Until: all predictors are in the model
The least angle regression procedure follows the same general scheme, but doesn't add a predictor fully into the model. The coefficient of that predictor is increased only until that predictor is no longer the one most correlated with the residual r. Then some other competing predictor is invited to "join the club".
Least angle regression algorithm:
- Start with all coefficients bj equal to zero.
- Find the predictor xj most correlated with y
- Increase the coefficient bj in the direction of the sign of its correlation with y. Take residuals r=y-yhat along the way. Stop when some other predictor xk has as much correlation with r as xj has.
- Increase (bj, bk) in their joint least squares direction, until some other predictor xm has as much correlation with the residual r.
- Continue until: all predictors are in the model
Surprisingly it can be shown that, with one modification, this procedure gives the entire path of lasso solutions, as s is varied from 0 to infinity. The modification needed is: if a non-zero coefficient hits zero, remove it from the active set of predictors and recompute the joint direction.
Machine Learning 2009. 12. 3. 21:56
http://anybody-has-a-blog.tistory.com/80
에서 퍼왔습니다.
1. OpenCV Framework 를 얻는다.
http://opencvlibrary.sourceforge.net/Mac_OS_X_OpenCV_Port 에서 미리 빌드된 것을 다운 받거나, 아니면 소스코드에서 빌드한다.
2. OpenCV.framework 폴더를 Framework들이 모여있는 장소인 /System/Library/Framework 에 복사해 넣는다.
3. XCODE 를 실행해 새로운 Empty Project를 만들고, main.cpp 를 추가한다.
4. OpenCV framework를 사용하기 위해 Add -> Existing Frameworks 메뉴를 이용해 OpenCV framework를 추가 한다. 그림에서는 소스코드와 framework를 구분하기 위해 폴더를 만들어 사용하였다.
5. 다음으로 Targets 에서 오른쪽 클릭을 통해 Add new target 을 선택한 다음 Carbon Application을 선택하고 빌드될 어플의 이름을 정한다.
6. Target->OpenCVTest 의 하위 항목에 필요한 것들을 Drag and Drop 으로 추가한다.
main.cpp -> Compile Sources
OpenCV.framework -> Link With Binary Libraries
7. OpenCV framework 가 어플 내에 함께 들어가야 하므로 새로운 Build phase를 아래 그림과 같이 추가한다.
Build phase를 추가하면 Info 창이 뜨게 되는데 에서 Destination 항목은 기본으로 Resources로 설정되어 있으나 이것을 Frameworks 로 바꾸어준다. Info 창에서 경로 지정을 할 필요없이 앞서와 같이 framework를 해당 위치에 끌어다 놓으면 된다.
8. 환경 셋팅이 끝나면 아래 그림과 같은 항목들이 Targets에 들어가 있어야 한다.
9. 준비가 다 되었으니 이제 할 일은 프로그램을 짜는 것이다. main.cpp 에 프로그램을 짜고 실행한다. OpenCV를 Framework 형태로 사용할 경우에는 Header로 하나만 넣으면 cv, cxcore, highgui, ml 을 모두 포함하므로 이것들을 따로 포함할 필요는 없다.
아래 링크는 위의 과정을 수행하여 만들어 놓은 예제 이므로 필요한 사람은 가져다 쓰시면 되겠다. 실행 테스트는 10.5.2 에서 이루어졌다.
프로그램 실행 결과
그렇지만 매번 위와 같은 과정을 수행하거나 예제를 복사해서 사용하는 것이 불편하다면 위 링크의 예제의 폴더명을 OpenCV Application으로 바꾼 후, 아래 경로에 복사한다.
/Library/Application Support/Developer/Shared/Xcode/Project Templates/Application
이렇게 해 놓으면 XCODE에서 새로운 프로젝트를 만들 때 아래 그림처럼 OpenCV Application이라는 항목이 생기므로 쉽게 프로젝트를 만들어 사용할 수 있다.
Machine Learning 2009. 3. 30. 18:04
http://mil.engr.utk.edu/nmil/cfps
Machine Learning 2009. 3. 11. 11:38
Operators
| Symbol |
Command |
Symbol |
Command |
Symbol |
Command |
 |
\pm |
 |
\mp |
 |
\times |
 |
\div |
 |
\cdot |
 |
\ast |
 |
\star |
 |
\dagger |
 |
\ddagger |
 |
\amalg |
 |
\cap |
 |
\cup |
 |
\uplus |
 |
\sqcap |
 |
\sqcup |
 |
\vee |
 |
\wedge |
 |
\oplus |
 |
\ominus |
 |
\otimes |
 |
\circ |
 |
\bullet |
 |
\diamond |
 |
\lhd |
 |
\rhd |
 |
\unlhd |
 |
\unrhd |
 |
\oslash |
 |
\odot |
 |
\bigcirc |
 |
\triangleleft |
 |
\Diamond |
 |
\bigtriangleup |
 |
\bigtriangledown |
 |
\Box |
 |
\triangleright |
 |
\setminus |
 |
\wr |
|
|
Return to top
Relations
| Symbol |
Command |
Symbol |
Command |
Symbol |
Command |
 |
\le |
 |
\ge |
 |
\neq |
 |
\sim |
 |
\ll |
 |
\gg |
 |
\doteq |
 |
\simeq |
 |
\subset |
 |
\supset |
 |
\approx |
 |
\asymp |
 |
\subseteq |
 |
\supseteq |
 |
\cong |
 |
\smile |
 |
\sqsubset |
 |
\sqsupset |
 |
\equiv |
 |
\frown |
 |
\sqsubseteq |
 |
\sqsupseteq |
 |
\propto |
 |
\bowtie |
 |
\in |
 |
\ni |
 |
\prec |
 |
\succ |
 |
\vdash |
 |
\dashv |
 |
\preceq |
 |
\succeq |
 |
\models |
 |
\perp |
 |
\parallel |
 |
\| |
 |
\mid |
|
|
|
|
Negations of many of these relations can be formed by just putting \not before the symbol, or by slipping an n between the \ and the word. Here are a few examples, plus a few other negations; it works for many of the others as well.
| Symbol |
Command |
Symbol |
Command |
Symbol |
Command |
 |
\nmid |
 |
\nleq |
 |
\ngeq |
 |
\nsim |
 |
\ncong |
 |
\nparallel |
 |
\not< |
 |
\not> |
 |
\not= |
 |
\not\le |
 |
\not\ge |
 |
\not\sim |
 |
\not\approx |
 |
\not\cong |
 |
\not\equiv |
 |
\not\parallel |
 |
\nless |
 |
\ngtr |
 |
\lneq |
 |
\gneq |
 |
\lnsim |
 |
\lneqq |
 |
\gneqq |
|
|
Return to top
Greek Letters
Lowercase letters
| Symbol |
Command |
Symbol |
Command |
Symbol |
Command |
Symbol |
Command |
 |
\alpha |
 |
\beta |
 |
\gamma |
 |
\delta |
 |
\epsilon |
 |
\varepsilon |
 |
\zeta |
 |
\eta |
 |
\theta |
 |
\vartheta |
 |
\iota |
 |
\kappa |
 |
\lambda |
 |
\mu |
 |
\nu |
 |
\xi |
 |
\pi |
 |
\varpi |
 |
\rho |
 |
\varrho |
 |
\sigma |
 |
\varsigma |
 |
\tau |
 |
\upsilon |
 |
\phi |
 |
\varphi |
 |
\chi |
 |
\psi |
 |
\omega |
|
|
|
|
|
|
Capital letters
| Symbol |
Command |
Symbol |
Command |
Symbol |
Command |
Symbol |
Command |
 |
\Gamma |
 |
\Delta |
 |
\Theta |
 |
\Lambda |
 |
\Xi |
 |
\Pi |
 |
\Sigma |
 |
\Upsilon |
 |
\Phi |
 |
\Psi |
|
|
|
|
Return to top
Arrows
| Symbol |
Command |
Symbol |
Command |
 |
\gets |
 |
\to |
 |
\leftarrow |
 |
\Leftarrow |
 |
\rightarrow |
 |
\Rightarrow |
 |
\leftrightarrow |
 |
\Leftrightarrow |
 |
\mapsto |
 |
\hookleftarrow |
 |
\leftharpoonup |
 |
\leftharpoondown |
 |
\rightleftharpoons |
 |
\longleftarrow |
 |
\Longleftarrow |
 |
\longrightarrow |
 |
\Longrightarrow |
 |
\longleftrightarrow |
 |
\Longleftrightarrow |
 |
\longmapsto |
 |
\hookrightarrow |
 |
\rightharpoonup |
 |
\rightharpoondown |
 |
\leadsto |
 |
\uparrow |
 |
\Uparrow |
 |
\downarrow |
 |
\Downarrow |
 |
\updownarrow |
 |
\Updownarrow |
 |
\nearrow |
 |
\searrow |
 |
\swarrow |
 |
\nwarrow |
Return to top
Dots
| Symbol |
Command |
Symbol |
Command |
Symbol |
Command |
Symbol |
Command |
 |
\ldots 2 |
 |
\vdots |
 |
\cdots 2 |
 |
\ddots |
(The '2's after \ldots and \cdots are only present to make the distinction between the two clear.)
Return to top
Accents
| Symbol |
Command |
Symbol |
Command |
Symbol |
Command |
 |
\hat{x} |
 |
\check{x} |
 |
\dot{x} |
 |
\breve{x} |
 |
\acute{x} |
 |
\ddot{x} |
 |
\grave{x} |
 |
\tilde{x} |
 |
\mathring{x} |
 |
\bar{x} |
 |
\vec{x} |
|
|
When applying accents to i and j, you can use \imath and \jmath to keep the dots from interfering with the accents:
| Symbol |
Command |
Symbol |
Command |
 |
\vec{\jmath} |
 |
\tilde{\imath} |
\tilde and \hat have wide versions that allow you to accent an expression:
| Symbol |
Command |
Symbol |
Command |
 |
\widehat{3+x} |
 |
\widetilde{abc} |
Return to top
Others
| Symbol |
Command |
Symbol |
Command |
Symbol |
Command |
 |
\infty |
 |
\triangle |
 |
\angle |
 |
\aleph |
 |
\hbar |
 |
\imath |
 |
\jmath |
 |
\ell |
 |
\wp |
 |
\Re |
 |
\Im |
 |
\mho |
 |
\prime |
 |
\emptyset |
 |
\nabla |
 |
\surd |
 |
\partial |
 |
\top |
 |
\bot |
|
\vdash |
|
\dashv |
 |
\forall |
 |
\exists |
 |
\neg |
 |
\flat |
 |
\natural |
 |
\sharp |
 |
\backslash |
|
\Box |
|
\Diamond |
 |
\clubsuit |
 |
\diamondsuit |
 |
\heartsuit |
 |
\spadesuit |
 |
\Join |
 |
\blacksquare |
Didn't find what you want? Or do you want a printable list? The Comprehensive LaTex Symbol list has just about any symbol that you could possibly want.
Return to top
Bracketing Symbols
In mathematics, sometimes we need to enclose expressions in brackets or braces or parentheses. Some of these work just as you'd imagine in LaTeX; type ( and ) for parentheses, [ and ] for brackets, and | and | for absolute value. However, other symbols have special commands:
| Symbol |
Command |
Symbol |
Command |
Symbol |
Command |
 |
\{ |
 |
\} |
|
\| |
|
\backslash |
 |
\lfloor |
 |
\rfloor |
 |
\lceil |
 |
\rceil |
 |
\langle |
 |
\rangle |
|
|
|
|
You might notice that if you use any of these to typeset an expression that is vertically large, like
\displaystyle (1 + \frac{a}{x} )^2
the parentheses don't come out the right size:

If we put \left and \right before the relevant parentheses, we get a prettier expression:
\displaystyle \left(1 + \frac{a}{x} \right)^2
gives

\left and \right can also be used to resize the following symbols:
| Symbol |
Command |
Symbol |
Command |
Symbol |
Command |
|
\uparrow |
|
\downarrow |
|
\updownarrow |
|
\Uparrow |
|
\Downarrow |
|
\Updownarrow |
Return to top
Multi-Size Symbols
Some symbols render differently in regular math mode and in display mode (display mode occurs when you use \displaystyle, $$...$$, or \[...\]). Read more in the commands section of the guide about how symbols which take arguments above and below the symbols, such as a summation symbol, behave in the two modes.
In each of the following, the two images show the symbol in regular mode, then in display mode.
| Symbol |
Command |
Symbol |
Command |
Symbol |
Command |
  |
\sum |
  |
\int |
  |
\oint |
  |
\prod |
  |
\coprod |
  |
\bigcap |
  |
\bigcup |
  |
\bigsqcup |
  |
\bigvee |
  |
\bigwedge |
  |
\bigodot |
  |
\bigotimes |
  |
\bigoplus |
  |
\biguplus |
|
(The two integral symbols render fine in a full LaTeX document .)
복잡한 수식
여러 줄에 이어 계속되는 식이 = 등에 의해 정렬되는 경우는 eqnarray 환경을 쓰고 행렬처럼 가로세로로 정렬하려면 array, matrix 환경을 쓴다. 이러한 환경은 스스로 displaymath 모드로 바꿈으로 $$ ... $$ 로 묶지 않음에 유의하라. AMSLaTeX에서 제공하는 수식정렬 환경으로 align, gather, case 등의 환경이 있다. 다음의 예를 참고하라.
|

|
\begin{eqnarray}
Y & = & x^2+1 \\
y & > & a-b+c-d+e-f+\\
& & g-h+k-l+m
\end{eqnarray}
$$
\left( \begin{array}{rrr}
2-x & -2 & 3 \\
-3 & x-5 & 1 \\
0 & 1 & x+2
\end{array} \right)
$$
\begin{align}
2x+3y+z &= 0 \\
3x-2y+2z &= 0
\end{align}
\begin{gather}
1\\
x+x\\
x^2+2xy+y^2\\
x^3+3x^2y+3xy^2+y^3 \\
\end{gather}
|
eqnarray, align, gather 환경은 자동으로 수식번호를 매겨준다 (위 그림에서는 편의상 번호를 나타내지 않았다). 수식번호가 필요치 않은 경우 eqnarray*와 같이 끝에 *를 붙인다. 위 예에서 보듯이 &는 칸을 가르는 역할을 하고, \\는 줄바꿈을 한다. \begin{array}{rrr}에서 {rrr}은 array에 세 칸(열)이 있고 각 열은 오른쪽 정렬을 함을 나타낸다. r은 오른쪽 정렬을, c는 중앙정렬, l은 왼쪽정렬을 할 때 쓰인다.
|

|
$$
\varphi(x)=\begin{cases} e^{-1/x^2} & \text{ if $x\not=0$} \\
0 & \text{ if $x=0$.} \end{cases}
$$
\begin{gather*}
\begin{matrix} 1 & 0 \\ 0 & 1 \end{matrix} \quad
\begin{pmatrix} 1 & 0 \\ 0 & 1 \end{pmatrix} \\
\begin{bmatrix} 1 & 0 \\ 0 & 1 \end{bmatrix} \quad
\begin{vmatrix} 1 & 0 \\ 0 & 1 \end{vmatrix} \quad
\begin{Vmatrix} 1 & 0 \\ 0 & 1 \end{Vmatrix}
\end{gather*}
|
case 환경에서는 수학모드이기 때문에 \text{...}을 써서 보통 로만글꼴로 조건들을 표시하였음에 유의하라. 좀더 자세한 것은 AMSLaTeX User's Guide를 보자.
|


